What I did and didn’t do
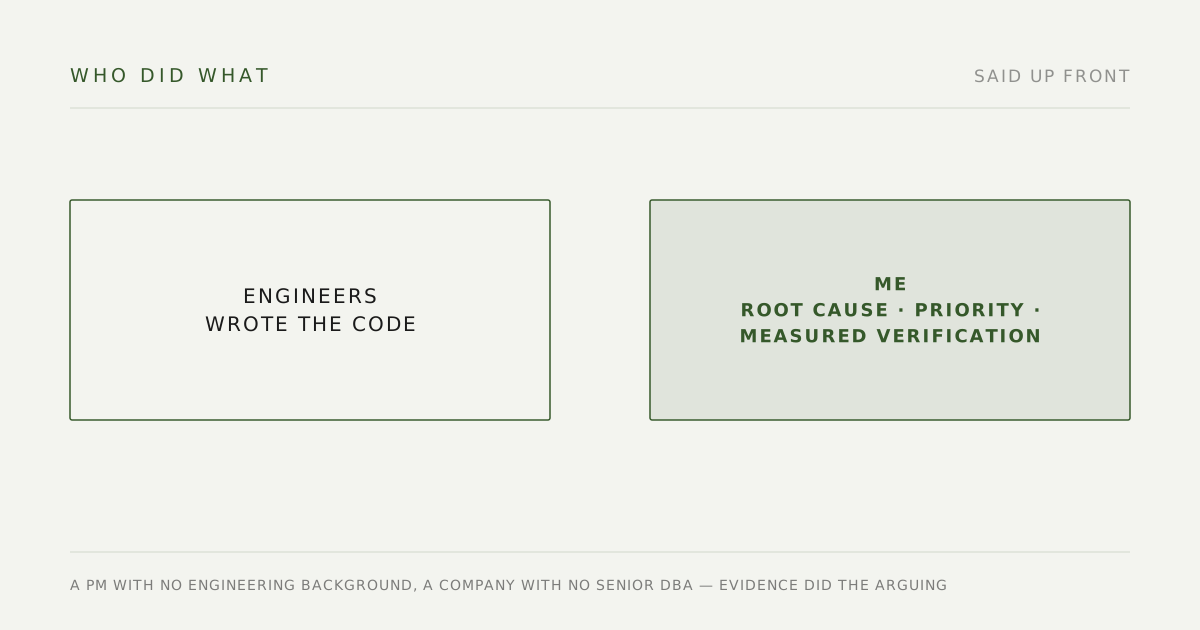
Engineers on my team wrote the code. I didn’t.
I did three other things: found the root causes, decided what to fix first, and proved with measurements afterwards that it was actually fixed. That’s why this one is worth writing up — it’s a case of a PM with no engineering background, at a company with no senior DBA, driving technical decisions with evidence.
The problem
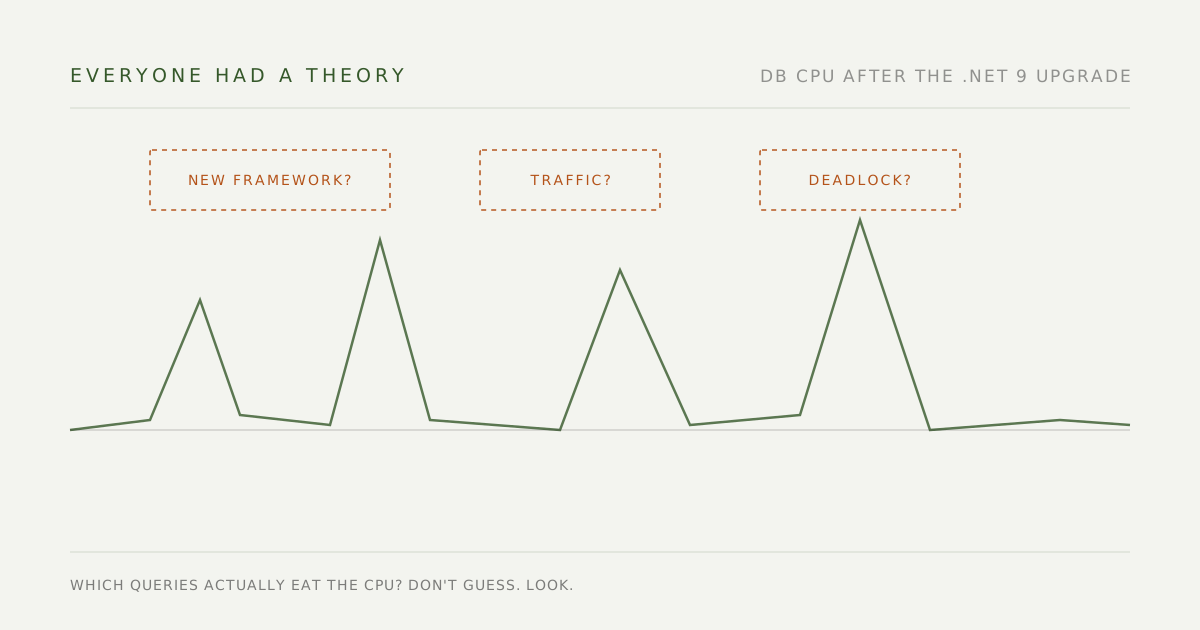
After the platform was upgraded to .NET 9, database CPU began spiking intermittently and checkout started timing out occasionally. The hard part about this class of problem is that everyone has a theory: maybe the new framework, maybe traffic growth, maybe checkout deadlocking against itself.
Two of the three paths had already been optimized — the survey query got a pass in December 2024 and another in October 2025. Both helped. Both shipped. Neither actually solved it.
The question I needed to answer was simple: which queries are actually eating the CPU? Not guess. Look.
What I did
1. Disprove the explanation everyone believed
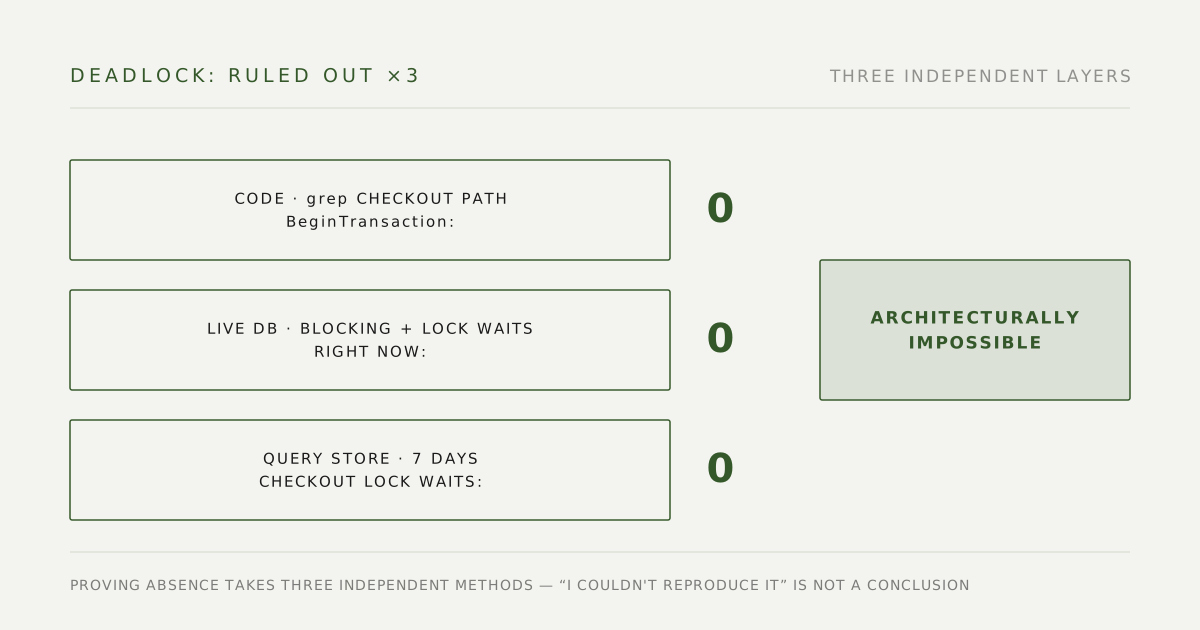
The leading theory was that checkout was deadlocking — two orders arriving at once and locking each other. It’s a plausible theory and a hard one to argue with, because “it only happens sometimes” can absorb any amount of contradicting evidence.
I ruled it out with three independent layers:
- Code. Grepping the entire checkout path turned up
BeginTransactionzero times. No transaction, no deadlock. - Live database state. Querying blocking in the moment: zero blocked sessions, zero lock waits.
- History. Seven days of Query Store: cumulative checkout-related lock waits of zero.
All three pointed the same way — architecturally it can’t happen. Proving something doesn’t exist is harder than finding something that does, so I refused to let “I couldn’t reproduce it” stand as the conclusion, and checked it three independent ways instead.
With that off the table, the real culprits surfaced.
2. For impact, use the customers’ pain — not my stopwatch
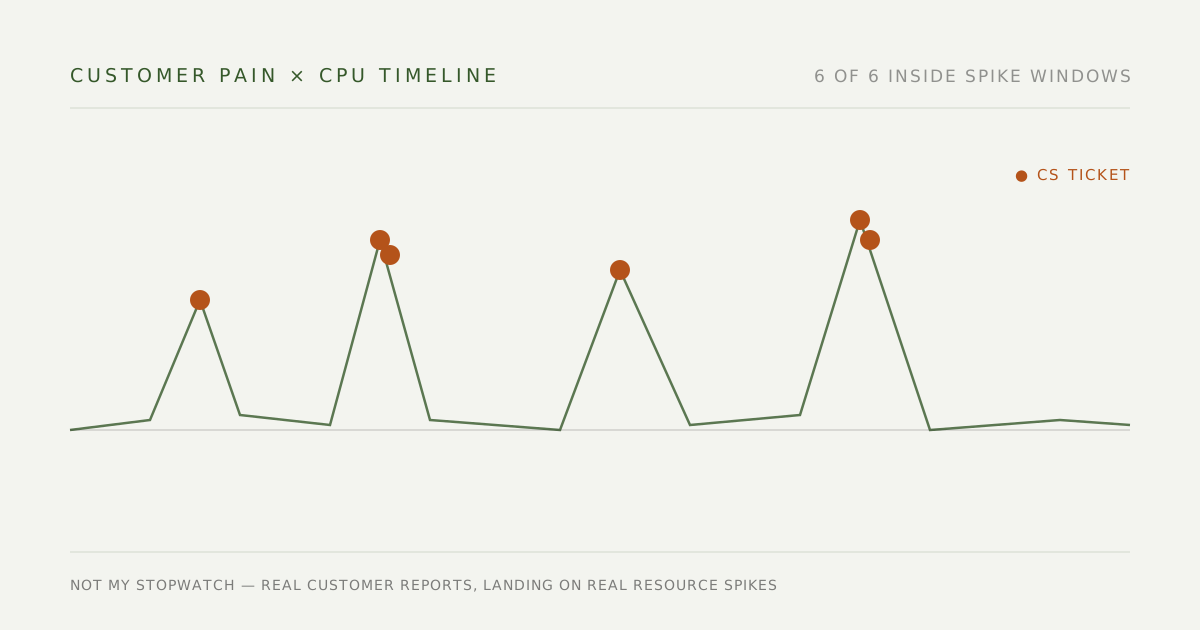
How slow does “checkout is slow” have to be before it justifies surgery? My first instinct was to use my own timed test runs as evidence. I threw them out — a number I clock from my office desk describes that moment, that network, that machine, and it can’t carry the weight of a decision that touches the payment path.
What I used instead: I pulled every “checkout problem” ticket customer service had received over the period and laid them on the database CPU timeline. Six incidents; every one of them landed inside a CPU spike window. Evidence like this does two jobs at once: it’s real customer pain, not my perception — and when incident timestamps line up with resource metrics, the direction of causality stands on its own.
Choosing your evidence matters as much as choosing your query. You don’t want “it feels slow” — you want “customers are hurting, and the hurting lines up with the metrics.”
3. Find each root cause
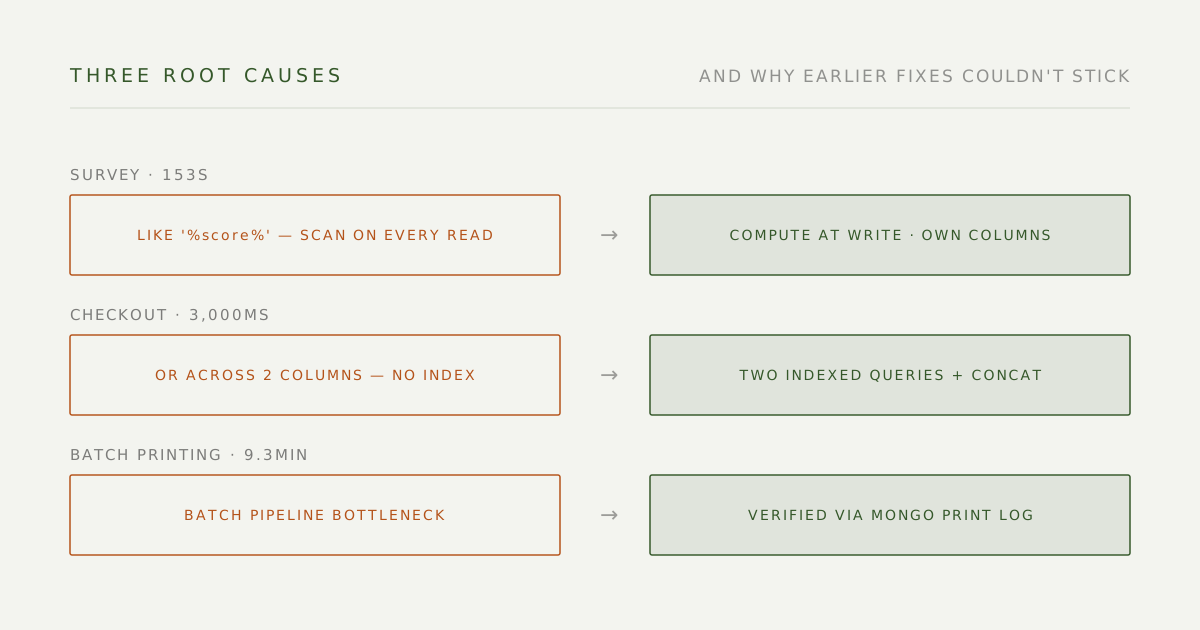
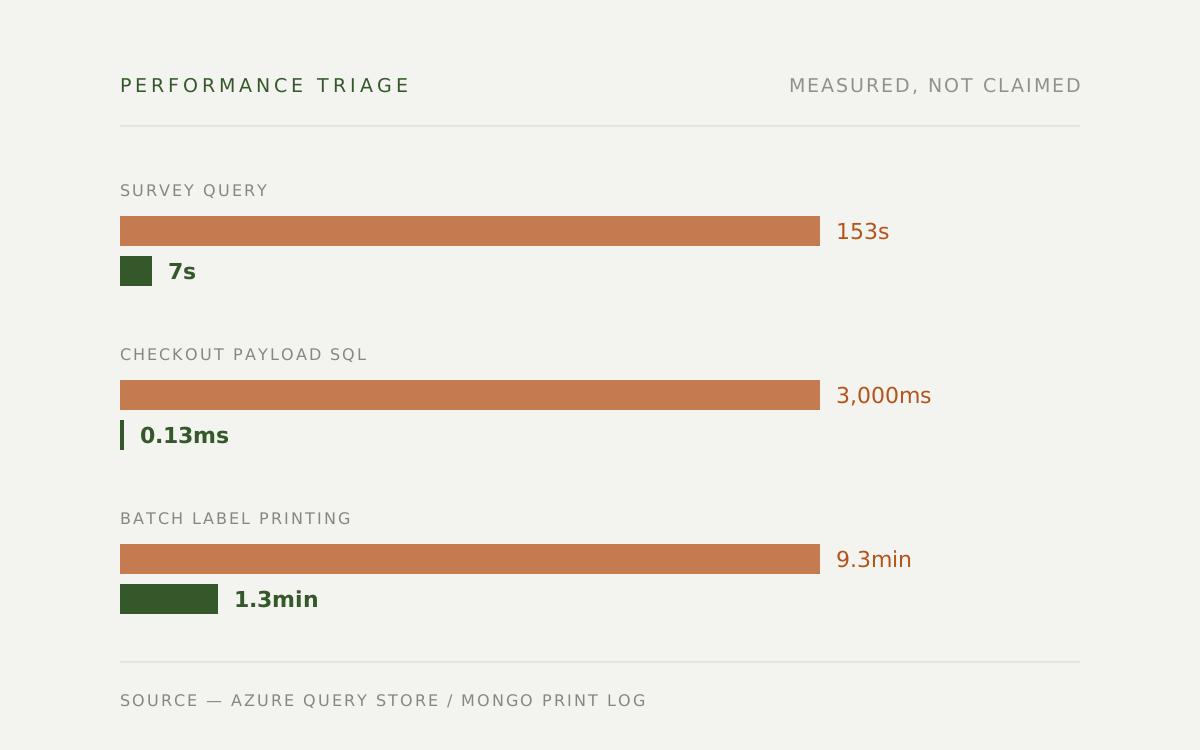
Survey query (153 seconds). The old approach was WHERE Reply LIKE '%score%' — scanning the full text of every review on every query, because the score lived inside a JSON blob and was computed at read time. This was never a query-writing problem; it was a data structure problem — which is exactly why two rounds of “add a view column” and “add a cache” could only ever treat the symptom.
The fix computed the score at write time into its own columns and tables, migrated with dual-write plus backfill and a staged cutover. It was the only attempt that touched the underlying structure, and the only one that actually resolved it.
Checkout payload SQL (3,000ms). The LINQ read Where(w => w.OrdersId == X || w.AddOrderId == Y). That OR meant the database couldn’t use either index and fell back to a full table scan. The fix was small — split it into two indexed queries and concatenate — and took 3,000ms to 0.13ms.
One line of query style. Twenty thousand times.
Batch label printing (9.3 minutes). Verified straight against the Mongo print log: 721 real print runs before, 486 after, with the median dropping from 4.8 seconds to 1.1.
4. Ship in waves, not all at once
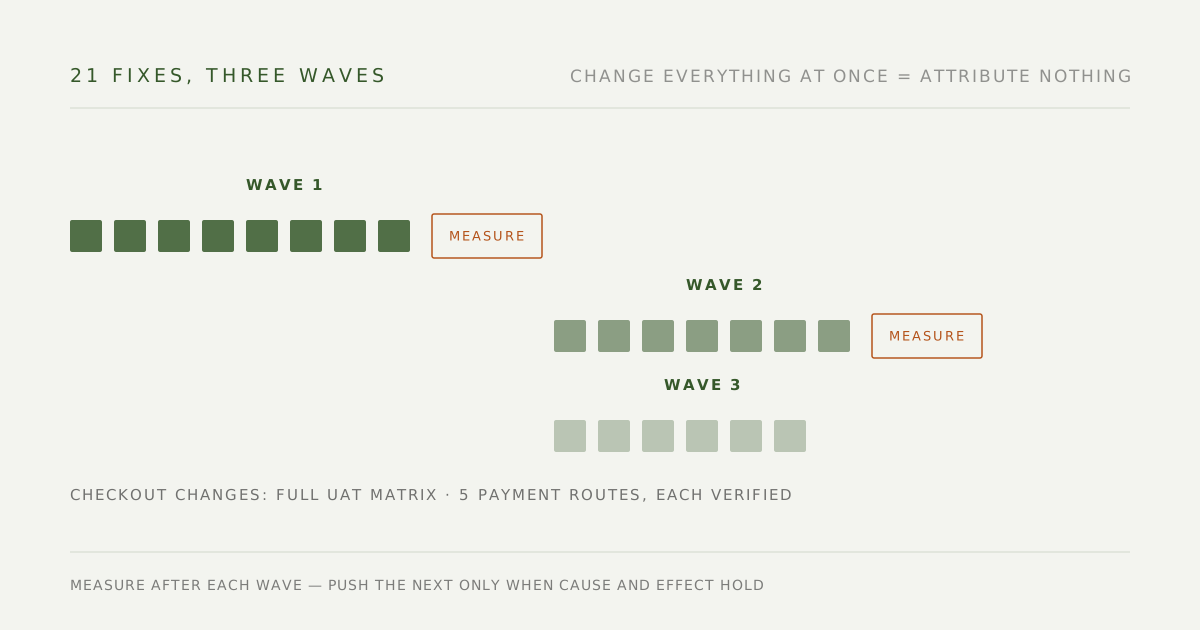
There were more than three items — the full list ran to 21. But changing everything at once makes attribution impossible: fix twenty things, watch the system get faster, and you’ll never know which fix worked and which was wasted effort. I sequenced the 21 items into three waves by risk and expected payoff, measured after each wave, and only pushed the next once cause and effect held.
The checkout change touched the payment path, so it went through a full test matrix on its own: five payment routes (web saved card, web LinePay, web retry payment, app LinePay, app ECPay) each verified before production.
Results
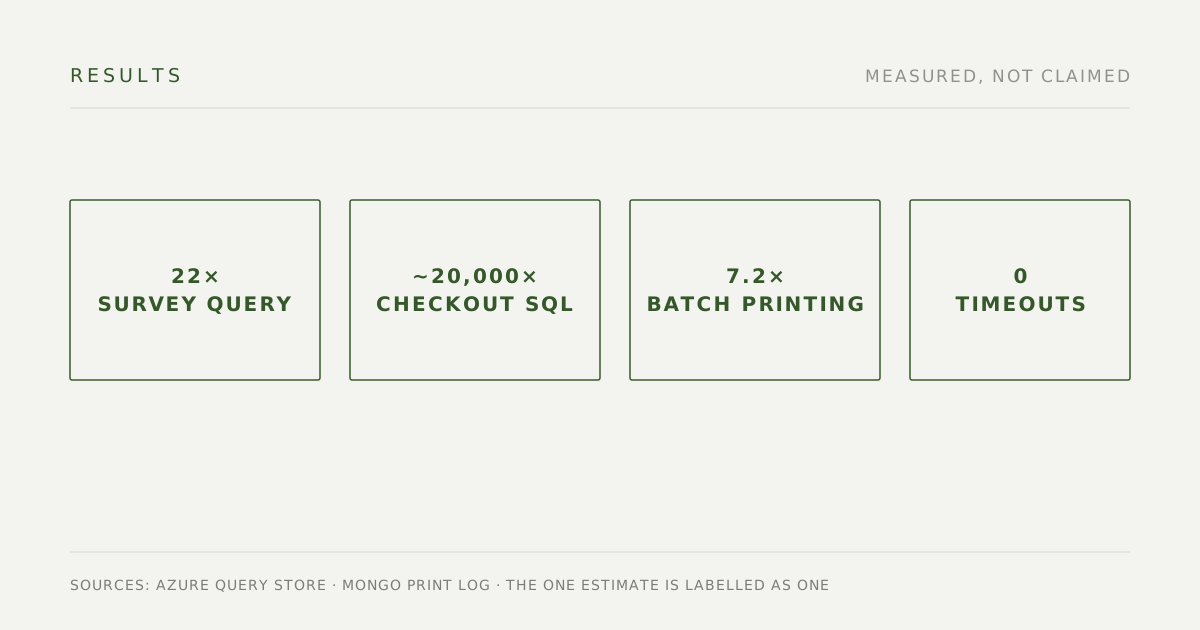
| Before | After | |
|---|---|---|
| Survey query, slowest single run | 153s | 7s |
| Survey query, monthly CPU | ~44,000 CPU-sec (estimated) | 39.8 CPU-sec (measured) |
| Checkout payload SQL | ~3,000ms | 0.13ms |
| Batch printing, slowest run | 9.3 min | 1.3 min |
| Single label, median | 4.8s | 1.1s |
| Checkout timeouts | Intermittent | 0 |
Post-launch, eight saved-card checkouts averaged 5.06 seconds with zero timeouts. Before the fix, the same test hit the 30-second timeout.
Every figure is sourced: performance numbers from Azure Query Store, print numbers from the Mongo print log. The one estimate — pre-fix monthly CPU — is labelled as an estimate, because the original record had already aged past the 30-day retention window. That’s how it appears in the report to leadership too.
Writing my judgment into automation
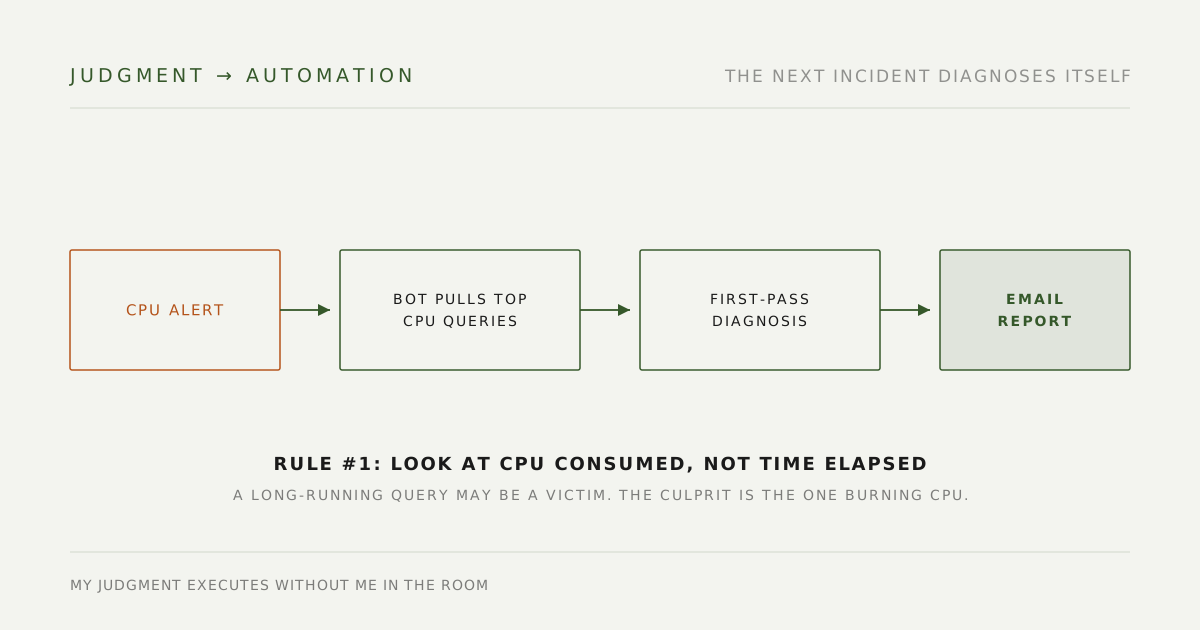
After the project wrapped, I did one more thing: I took what these six months taught me about “how to tell who the culprit is,” wrote it down as rules, and handed the rules to a resident monitoring bot — when a database CPU alert fires, it automatically pulls the top CPU consumers of that moment, runs a first-pass diagnosis, and mails me the analysis.
The most important rule is one I learned by getting it wrong: look at CPU consumed, not time elapsed. A query that runs long may just be waiting — on locks, on IO — which makes it a victim, not a culprit. The culprit is the one burning CPU. Once that rule lives in the bot, my judgment executes without me in the room — and that’s my working definition of performance governance: not fixing a few queries, but making sure the next incident starts diagnosing itself.
Same symptom, different culprit
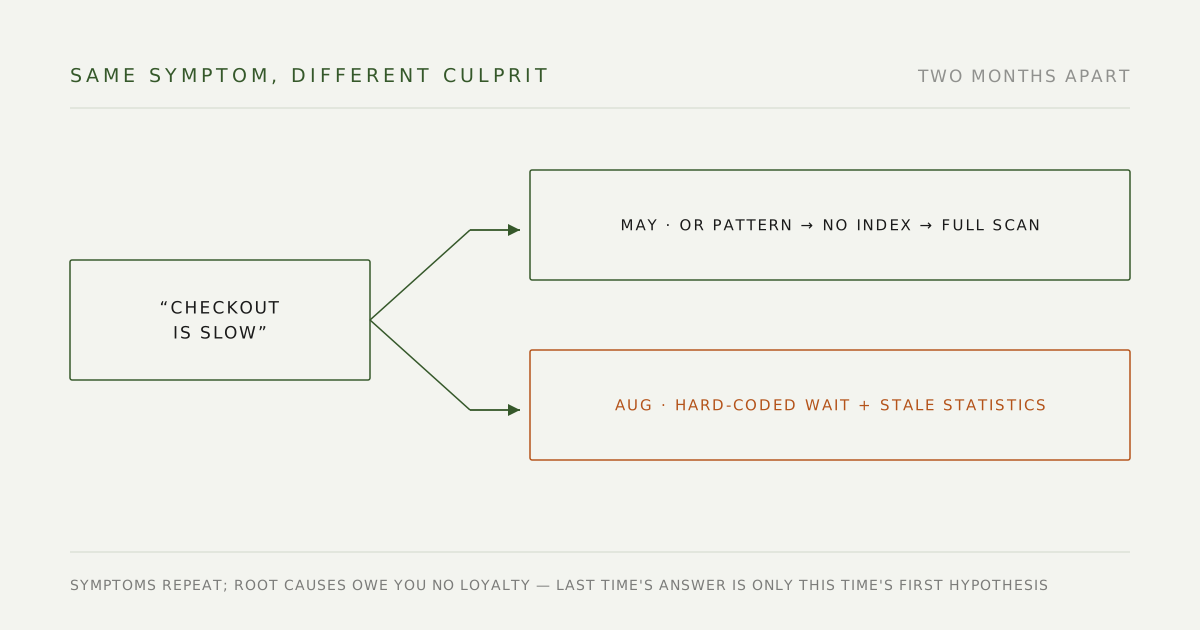
Two months later, “checkout is slow” came back. Copying last time’s answer — “probably SQL style again” — would have been wrong. Working it through step by step, this round was two entirely different things stacked together: a checkout transition page with a hard-coded fixed-seconds wait in it, plus stale database statistics amplifying the IO tail.
Symptoms repeat; root causes owe you no loyalty. Every recurrence gets a fresh investigation — last time’s conclusion is only this time’s first hypothesis.
What I took from it
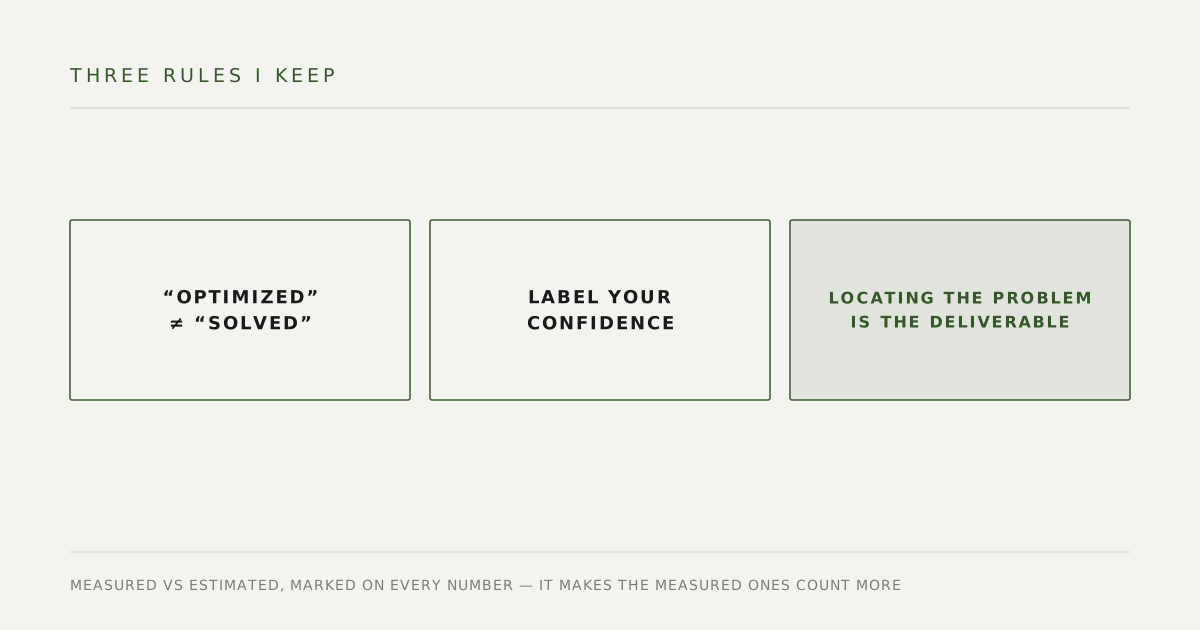
- “Already optimized” is not “already solved.” Both earlier attempts were genuinely effective and were reasonable choices at the time; the real bottleneck was the data structure, and restructuring was high-risk and estimated at a month or more, so it kept getting deferred. Explaining why this time worked mattered more than announcing the win.
- Label your confidence. In the report I split every number into measured versus estimated and stated the methodology. It didn’t weaken the report — it made the measured numbers count for more.
- Don’t claim the credit, but don’t undersell the contribution either. Engineers wrote the code. But these three paths had been sitting there for over a year with nobody knowing where to start. Locating the problem is the deliverable.
Stack
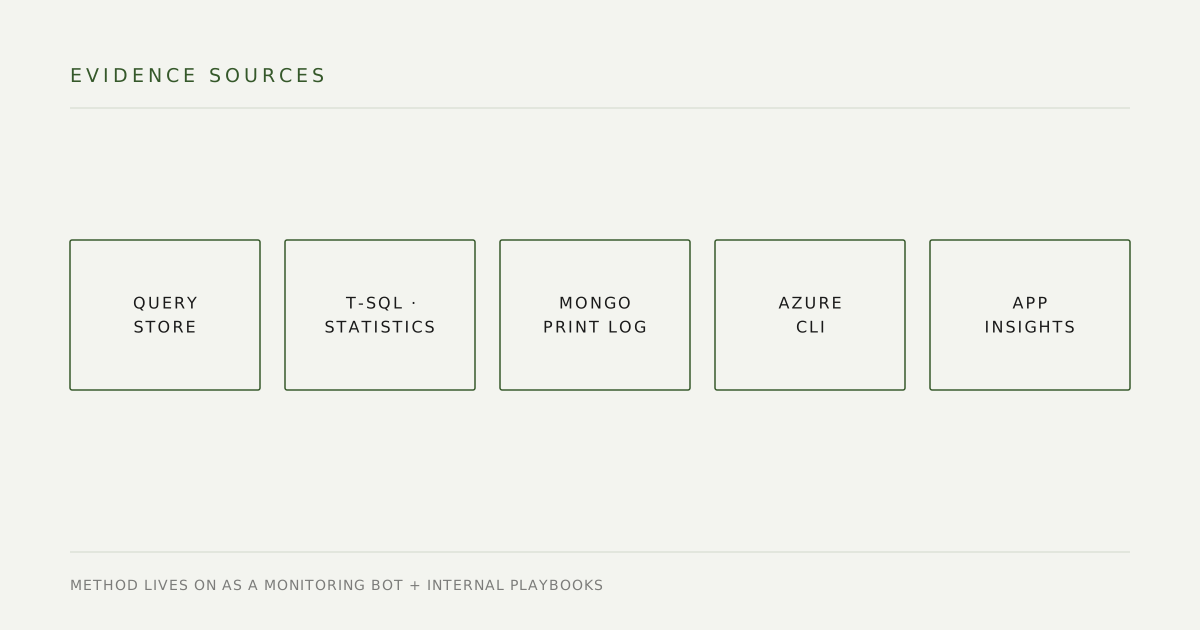
Azure Query Store, T-SQL, SQL Statistics, MongoDB, Azure CLI, Application Insights.
The diagnostic method and judgment rules now live on as a resident monitoring bot and internal playbooks.